
I wrote about claims on Life Insurance pay-out by NTUC Income for the month of October in 2010. The figure below shows the same period 8 years later in 2018. How much have change?
Claims Settled In October 2018
| Type of Claims | Number | Amount (S$) |
|---|---|---|
| Death | 135 | 7,095,721 |
| Critical illness | 108 | 5,823,076 |
| Permanent & total disability | 6 | 276,108 |
| Total | 249 | $13,194,905 |
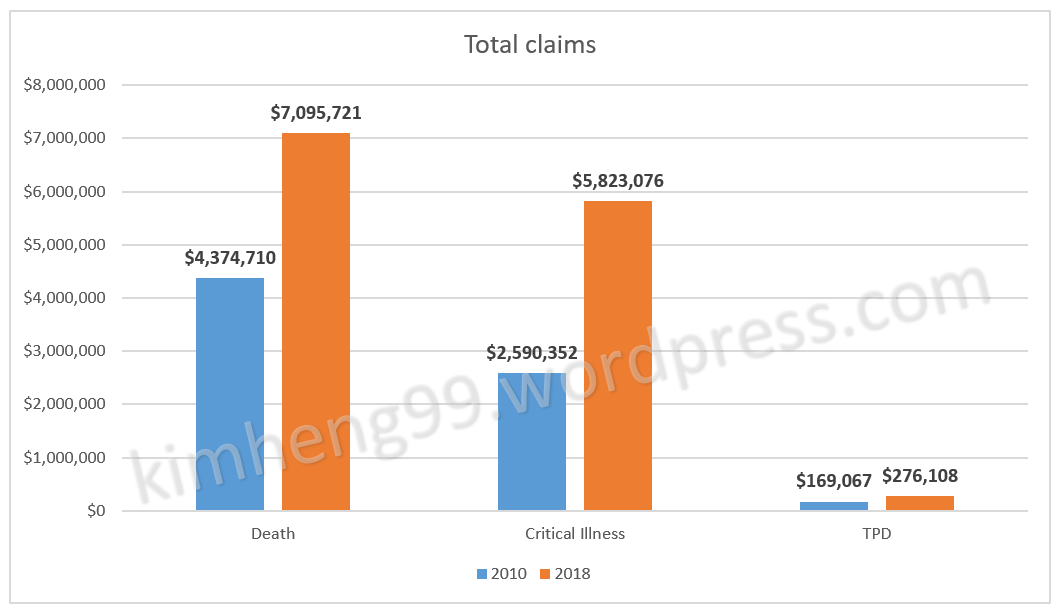
It is interesting to see while the total amount for Death and Critical Illness are higher in 2018 as compared to 2010, the average case claimed was not significantly higher. The average amount claimed per case for Death was about $52,560 in 2018 and it is about $10,000 lesser in 2010.
For critical illness claims, it was $51,807/case claim in 2010 and it increased to just $53,917 in 2018. One major jump was the number of claims made for Critical Illness which had more than doubled from just 50 cases in 2010 and the current 108 cases in 2018. It was also noted that the claims for Total and permanent disability was very low.
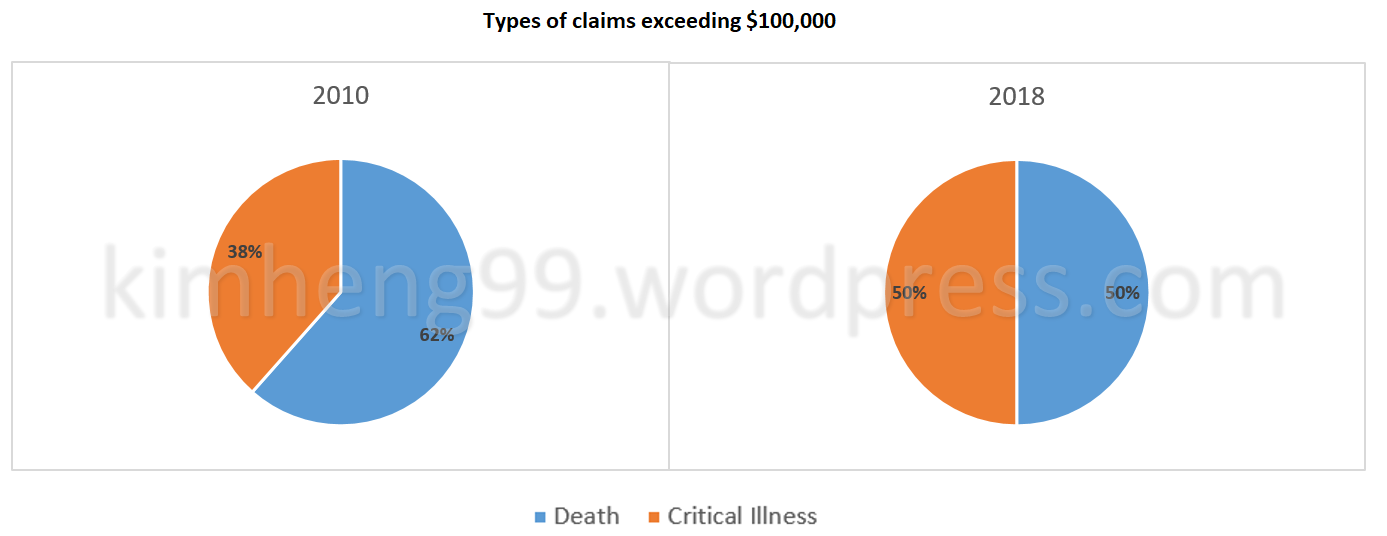
However, the amount claimed per case is not a good indication of the average coverage a policy holder is covered. It may not indicate that the coverage had not increase over the last 8 years as there is a possibility that there is a possibility that there is a huge sum assured e.g. $300,000 and the rest are made up of small coverage like $50,000. A better gauge is how many claims are made for coverage above $100,000 which is also, IMHO, the minimum amount one should be covered .
In Oct 2018, there were a total of 38 cases that exceeded $100,000 as compared to only 13 cases in 2010. It is also interesting to note that the claims for critical illness were significantly much higher today than in 2010.
Claims Exceeding $100,000
| No. | Type | Age | Cause | Amount (S$) |
|---|---|---|---|---|
| 1 | Death | 43 | Heart Attack | 150,674 |
| 2 | Death | 44 | Others, Unknown | 186,264 |
| 3 | Death | 45 | Suicide | 125,000 |
| 4 | Death | 46 | Cancer | 111,596 |
| 5 | Death | 47 | Stroke | 553,297 |
| 6 | Death | 53 | Cancer | 385,214 |
| 7 | Death | 55 | Chronic Lung Disease | 111,826 |
| 8 | Death | 56 | Cancer | 201,230 |
| 9 | Death | 56 | Accident | 200,462 |
| 10 | Death | 58 | Cancer | 306,606 |
| 11 | Death | 61 | Cancer | 255,158 |
| 12 | Death | 65 | Cancer | 145,427 |
| 13 | Death | 66 | Cancer | 295,108 |
| 14 | Death | 70 | Cancer | 151,088 |
| 15 | Death | 73 | Others, Unknown | 115,949 |
| 16 | Death | 73 | Heart Attack | 279,514 |
| 17 | Death | 74 | Heart Attack | 112,781 |
| 18 | Death | 75 | Cancer | 210,000 |
| 19 | Death | 79 | Chronic Lung Disease | 119,096 |
| 20 | Critical illness | 32 | Cancer | 107,507 |
| 21 | Critical illness | 44 | Cancer | 270,993 |
| 22 | Critical illness | 46 | Cancer | 101,541 |
| 23 | Critical illness | 46 | Cancer | 186,381 |
| 24 | Critical illness | 46 | Cancer | 180,645 |
| 25 | Critical illness | 49 | Cancer | 150,000 |
| 26 | Critical illness | 50 | Cancer | 100,000 |
| 27 | Critical illness | 52 | Cancer | 158,599 |
| 28 | Critical illness | 55 | Heart Attack | 225,023 |
| 29 | Critical illness | 56 | Heart Attack | 158,354 |
| 30 | Critical illness | 59 | Cancer | 116,162 |
| 31 | Critical illness | 60 | Cancer | 122,212 |
| 32 | Critical illness | 61 | Heart Valve Surgery | 220,166 |
| 33 | Critical illness | 62 | Cancer | 110,335 |
| 34 | Critical illness | 63 | Stroke | 281,661 |
| 35 | Critical illness | 64 | Cancer | 185,083 |
| 36 | Critical illness | 65 | Cancer | 222,335 |
| 37 | Critical illness | 65 | Kidney Failure | 170,546 |
| 38 | Critical illness | 68 | Cancer | 128,299 |
| Total | $7,212,132 |
The claims made in 2010 and 2018 are summarised below in charts.

2 Comments